
Morristown, Morris Township & Harding Township, NJ • Real Estate Market Report • August 2026
Morristown NJ Real Estate Market Report: August 2026 — Home Prices, Inventory & Local Trends
By Kaitlyn Siracusa & The KCS Team at The Agency
Data source: Garden State MLS, reported through August 31, 2026

If you are buying or selling in Morristown, Morris Township, or Harding Township, the latest Garden State MLS data shows three neighboring markets moving in distinctly different ways.
This report uses July 2026 data, the latest completed month available as of August 31. New listings, homes for sale, and pending sales are monthly figures. Closed sales, median sale price, median percent of last list price, and median days on market are rolling 12-month figures. Keeping those time periods separate is essential to understanding the market accurately.
August 2026 At-a-Glance Comparison
| Market Metric | Morristown | Morris Township | Harding Township |
|---|---|---|---|
| July New Listings | 15 | 24 | 4 |
| July Homes for Sale | 17 | 44 | 6 |
| July Pending Sales | 14 | 15 | 6 |
| Closed Sales, Rolling 12 Months | 101 | 235 | 33 |
| Median Sale Price | $665K | $956K | $1.445M |
| Median Sale-to-List | 102.9% | 105.0% | 100.2% |
| Median Days on Market | 14 days | 16 days | 19 days |
Monthly statistics compare July of each year. Price, closed-sale, sale-to-list, and days-on-market figures are rolling 12-month results ending in July.
Morristown NJ Real Estate Market — August 2026
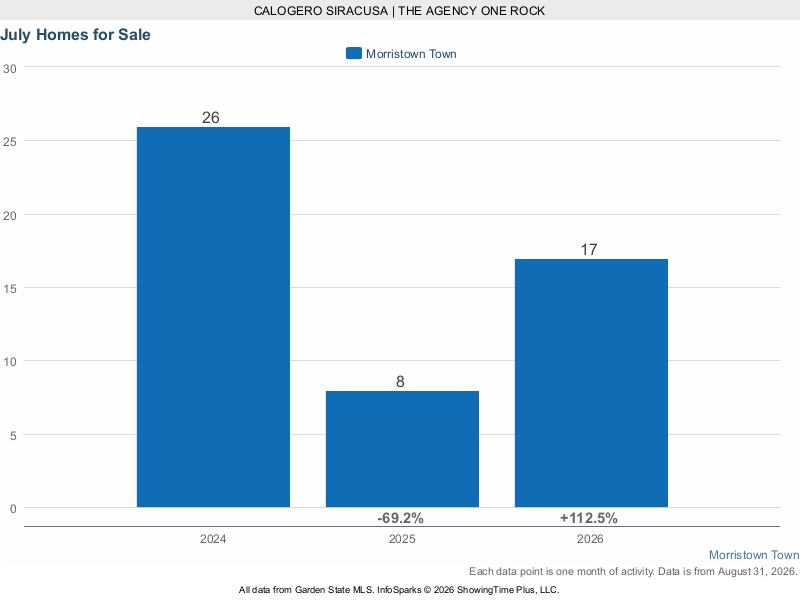
Morristown showed a meaningful improvement in available inventory compared with the unusually tight conditions of July 2025. The number of homes for sale increased from 8 to 17, while new listings increased from 8 to 15. Even with more choices, buyer activity kept pace: 14 properties went under contract, up from 13 a year earlier.
Over the rolling 12 months ending in July, Morristown recorded 101 closed sales, down from 115 during the prior 12-month period. The median sale price was $665,000, down 8.3% from $725,000 one year earlier but still 8.8% above the $611,250 median recorded two years earlier.
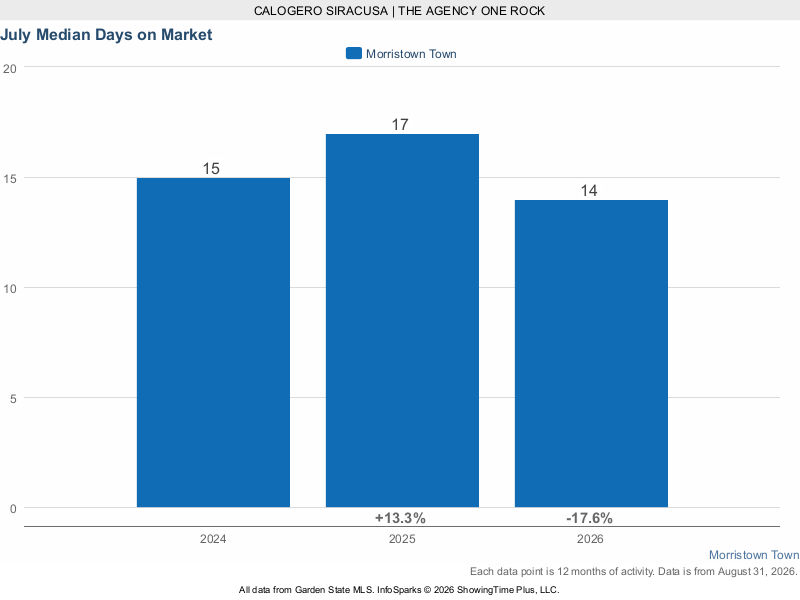
Competition remained strong. The median home sold for 102.9% of its final list price and went under contract in a median of only 14 days. Morristown buyers gained more inventory, but accurately priced homes continued to attract fast and competitive offers.
What Stands Out in Morristown?
The most important Morristown story is improving inventory without a loss of urgency. Homes for sale more than doubled year over year, yet pending sales increased and the typical property still sold above its final asking price. This is a healthier environment for buyers, but it is not a slow market.
Morris Township NJ Real Estate Market — August 2026
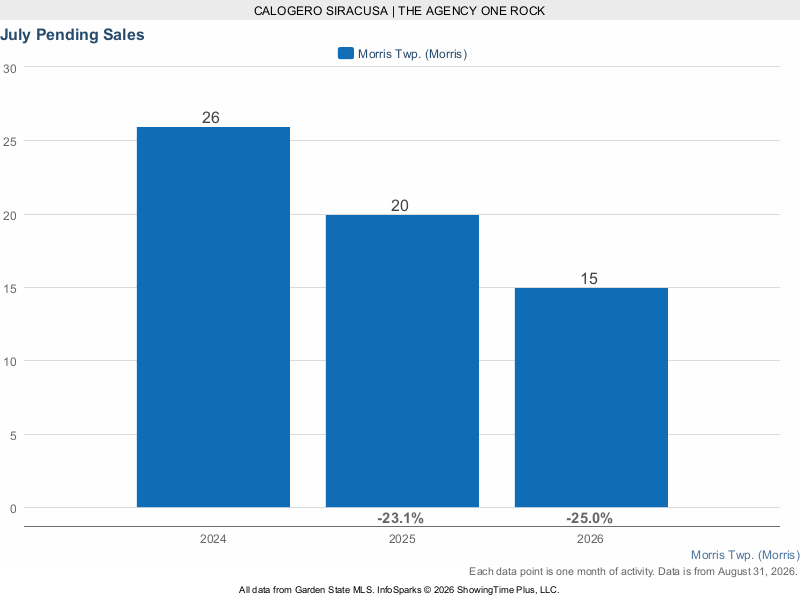
Morris Township entered the second half of 2026 with substantially more inventory. There were 44 homes for sale in July, up 57.1% from 28 one year earlier. New listings declined from 27 to 24, however, and monthly pending sales declined from 20 to 15.
Over the rolling 12 months ending in July, Morris Township recorded 235 closed sales, down 3.3% from 243. Despite that modest decline in transaction volume, the median sale price climbed to $956,000, up 14.5% from $835,000 a year earlier and 18.4% from $807,500 two years earlier.
Morris Township remained the most competitive of the three markets by sale-to-list performance. The median property sold for 105.0% of its final asking price. Median market time increased slightly from 14 to 16 days, which is still a very fast pace.
What Stands Out in Morris Township?
Inventory rose sharply, but the median price and sale-to-list ratio both strengthened. That combination suggests that buyers had more options while the best-positioned homes continued to generate intense competition. The decline in July pending sales is worth watching, but one month does not establish a trend by itself.
Harding Township NJ Real Estate Market — August 2026
Harding Township is a small luxury market, so modest changes in the number or mix of sales can produce large percentage swings. July brought 4 new listings and 6 homes for sale. Six properties went under contract, double the 3 pending sales recorded in July 2025.
Over the rolling 12 months ending in July, Harding recorded 33 closed sales, down 32.7% from 49 one year earlier. The median sale price was $1,445,000, down 17.9% from $1,760,000. That does not necessarily mean individual Harding homes lost 17.9% of their value. In a market with only 33 annual sales and highly varied estate properties, a shift in the mix of homes sold can move the median substantially.
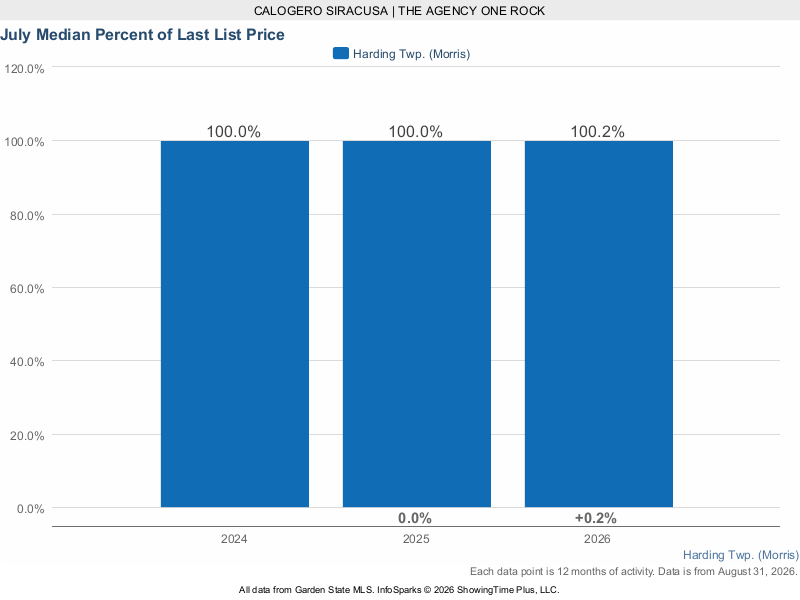
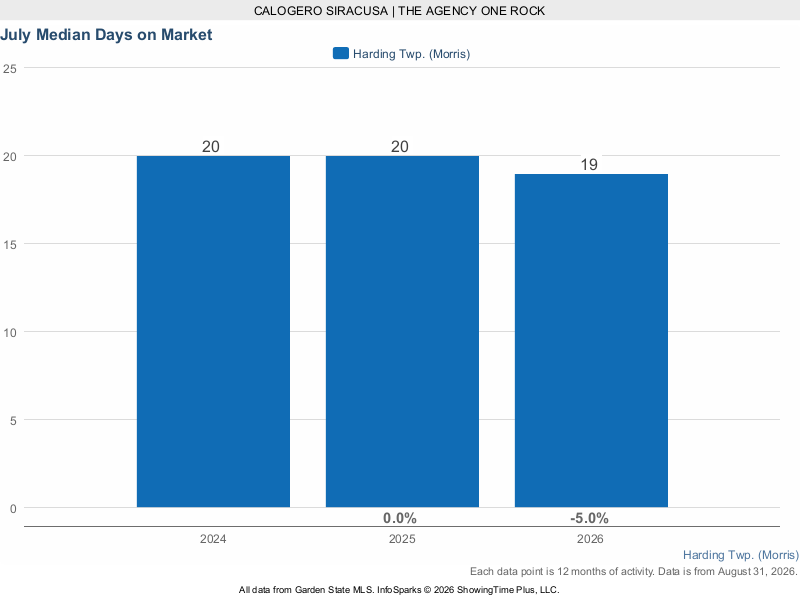
Demand for properly positioned homes remained evident. The median property sold for 100.2% of its final asking price, and median days on market improved slightly from 20 to 19 days.
What Stands Out in Harding Township?
July pending activity was strong relative to available inventory, but rolling annual sales and median price were lower. The most accurate reading is not that every Harding home declined in value. It is that fewer homes sold and the composition of those sales changed. Acreage, architecture, condition, renovations, privacy, and amenities remain central to pricing each Harding property.
Frequently Asked Questions About the Morristown Area Market
What are homes selling for?
- Morristown: The rolling 12-month median sale price was $665,000.
- Morris Township: The rolling 12-month median sale price was $956,000.
- Harding Township: The rolling 12-month median sale price was $1,445,000.
How quickly are homes selling?
- Morristown: Median market time was 14 days.
- Morris Township: Median market time was 16 days.
- Harding Township: Median market time was 19 days.
Are homes selling above asking price?
- Morristown: The median home sold for 102.9% of its final list price.
- Morris Township: The median home sold for 105.0% of its final list price.
- Harding Township: The median home sold for 100.2% of its final list price.
How much inventory was available in July?
- Morristown: 17 homes were for sale, up from 8 in July 2025.
- Morris Township: 44 homes were for sale, up from 28 in July 2025.
- Harding Township: 6 homes were for sale, up from 4 in July 2025.
How many homes went under contract in July?
- Morristown: 14 pending sales, up from 13 one year earlier.
- Morris Township: 15 pending sales, down from 20 one year earlier.
- Harding Township: 6 pending sales, up from 3 one year earlier.
How many homes sold during the latest rolling 12 months?
- Morristown: 101 closed sales, compared with 115 in the prior period.
- Morris Township: 235 closed sales, compared with 243 in the prior period.
- Harding Township: 33 closed sales, compared with 49 in the prior period.
Is the area still favorable to sellers?
- Morristown: Yes for well-priced homes. The median sale-to-list ratio was 102.9%, although buyers had more inventory than last year.
- Morris Township: Yes. A 105.0% median sale-to-list ratio and 16-day median market time point to continued competition.
- Harding Township: Conditions are property-specific, but a 100.2% median sale-to-list ratio shows that properly positioned luxury homes can still perform strongly.
Is Morris Township more expensive than Morristown?
- Morristown: The median price was $665,000, reflecting a broad mix of condominiums, townhomes, and single-family homes.
- Morris Township: The median was higher at $956,000, influenced by its larger concentration of traditional single-family homes.
- Harding Township: The median was $1.445 million, reflecting a distinct luxury and estate market.
What Buyers Should Know
More homes were available in all three communities than in July 2025, but the sale-to-list and market-time figures show that desirable homes still move quickly.
- Morristown buyers have more choice, particularly across its varied mix of housing, but should be ready to act when a well-priced property appears.
- Morris Township buyers should prepare for the greatest over-asking competition of the three markets.
- Harding Township buyers should evaluate each property individually and account for acreage, improvements, systems, and the limited number of comparable sales.
What Sellers Should Know
- Morristown sellers: Increased inventory makes presentation and pricing more important, even though the typical home still sold above asking.
- Morris Township sellers: The market continues to reward precise pricing, strong preparation, and strategic launch timing.
- Harding Township sellers: Broad town averages are less reliable for unique luxury properties. A property-specific valuation and marketing plan are essential.
Morristown Area Real Estate Outlook for Fall 2026
Morristown enters fall with more inventory, rising monthly pending activity, and a market time that remains very fast. Buyers have gained options without gaining much leverage over the best listings.
Morris Township has more homes available and fewer July pendings, but its rising median price and 105.0% sale-to-list ratio confirm that demand remains powerful for desirable single-family homes.
Harding Township showed strong July contract activity but lower rolling annual volume and median price. Because the market is small and property types vary widely, individual sales should be interpreted with care.
Morristown vs. Morris Township vs. Harding Township: Which One Fits You?
- Morristown: A strong fit for buyers who value walkability, restaurants, culture, train access, and a diverse range of housing.
- Morris Township: A strong fit for buyers seeking a classic suburban environment, more single-family inventory, and proximity to Morristown amenities.
- Harding Township: A strong fit for buyers seeking privacy, acreage, estate properties, and a rural luxury setting.
Thinking About Buying or Selling?
Kaitlyn Siracusa and The KCS Team at The Agency provide local real estate expertise throughout Morristown, Morris Township, Harding Township, and surrounding Morris County communities. Kaitlyn brings more than 20 years of real estate experience, and The KCS Team has completed more than 400 transactions.
Contact The KCS Team for a confidential consultation
Explore Morristown Real Estate
Explore Morris Township Real Estate
Explore Harding Township Real Estate
All data is sourced from Garden State MLS and ShowingTime Plus and was reported as of August 31, 2026. New listings, homes for sale, and pending sales are monthly July statistics. Closed sales, median sale price, median percent of last list price, and median days on market are rolling 12-month figures ending in July. Statistics may change as transactions are entered or updated. Information is deemed reliable but not guaranteed. This report is for general informational purposes and should not be interpreted as an appraisal of any individual property.
Posted by Carlo Siracusa on
Leave A Comment